![Experimental[3a]](plots/expt.png)
We use the TBMD code to calculate phonon frequency bands for Cu. The method applied is the frozen phonon approximation [1] and the dispersion curves are calculated along high-symmetry directions for fcc Cu. The TBMD code calculated the forces using the TB parameters at the equilibrium volume for Cu. The supercells in the calculation and phonon spectra are caclulated using Phonopy. A link to the source code and instructions for setting up Phonopy can be found here. Further details on the first principles phonon calculations in Phonopy can also be found in Ref [2].
Once Phonopy is properly installed, we can use it to generate the supercell positions to be used in the MD force calculation. For this, you will need the cu.in file. This is an input file for quantum Espresso (QE). Since we will be comparing the calculated phonon frequencies to experimental values [3], we won't need to run QE. More information on Quantum Espresso can be found from their page.
To start, create a directory cu_phonons and it should have the files:
-rw-r--r-- 1 ssilayi users 926 Jun 17 11:04 cu.in
The QE input file cu.in is used to generate supercell positions with Phonopy.
to generate 2x2x2 translations of the primitive cell in cu.in displacement files. You should now have additional files in your directory$phonopy --qe -d --dim="2 2 2" -c cu.in
-rw-r--r-- 1 ssilayi users 926 Jun 17 11:04 cu.in
-rw-r--r-- 1 ssilayi users 7081 Jun 17 11:22 phonopy_disp.yaml
-rw-r--r-- 1 ssilayi users 2413 Jun 17 11:22 supercell-001.in
-rw-r--r-- 1 ssilayi users 2413 Jun 17 11:22 supercell.in
We use the created supercell positions with displacements to build the POSTBMD file. Note that in the QE input file, distances are in atomic units while the TBMD input has the distances in Angstrom. After making that conversion, we have a POSTBMD file we can use for the TBMD run. For instructions on setting up the TBMD files and other descriptions refer to these pages.
If we created a separate cu_tbmd directory for the TBMD caclulation, we should have the following files in it:
                -rw------- 1 ssilayi users     319 Jun 17 12:26 INTBMD
                -rw-r--r-- 1 ssilayi users       8 Jun 17 12:26 KPTS
                -rw------- 1 ssilayi users    2298 Jun 17 12:26 POSTBMD
                -rwxr-xr-x 1 ssilayi users 4978586 Jun 17 12:26 tbmdk
                -rw-r--r-- 1 ssilayi users    7354 Jun 17 12:26 TBPARAM
to calculate the forces.$./tbmdk
We need the force_convert program generated using the extract_forces.f95 code to format the FORCE output file. So we add this to the directory and run
$./force_convert
The file of we need for the next step is the forces.qe .
to create the FORCES_SET file.$phonopy --qe -f forces.qe
DIM = 2 2 2
BAND = 0.0 0.0 0.0 0.5 0.0 0.5 0.5 0.25 0.75 0.5 0.0 0.5 0.375 0.375 0.75 0.0 0.0 0.0 0.5 0.5 0.5 0.375 0.375 0.75 0.5 0.25 0.75 0.5 0.5 0.5
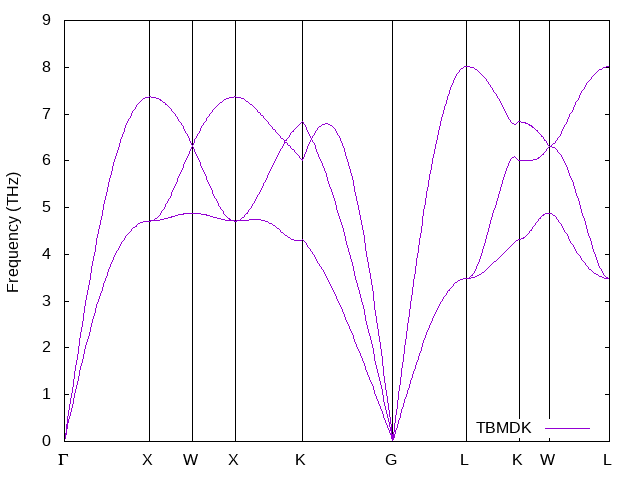
BAND_LABELS = $\Gamma$ X W X K $\Gamma$ L K W L
and this produces a plot of the phonon frequency dispersion. The plot is saved in the same directory.$phonopy --qe -c cu.in -p band.conf
$phonopy-bandplot --gnuplot band.yaml > cu_phonons_tbmd.dat
$gnuplot bandplot.gnu
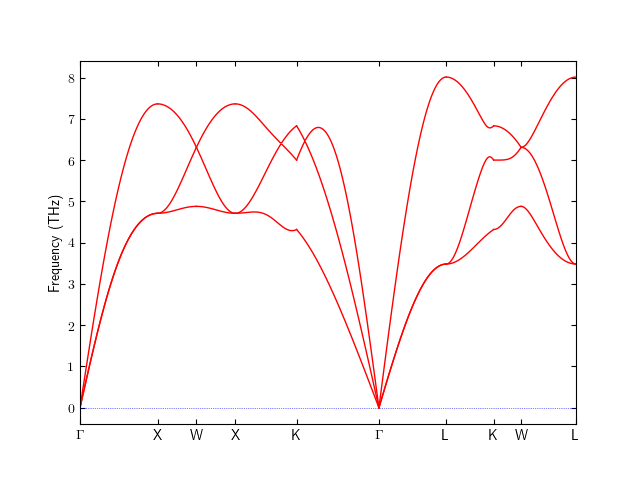
The final phonon frequency bands (left) compared to experimental values [3] (right)
To plot the phonon DOS, we need the mesh.conf file. This has information on the mesh sampling and the periodic translations
        DIM = 2 2 2
        MP = 21 21 21
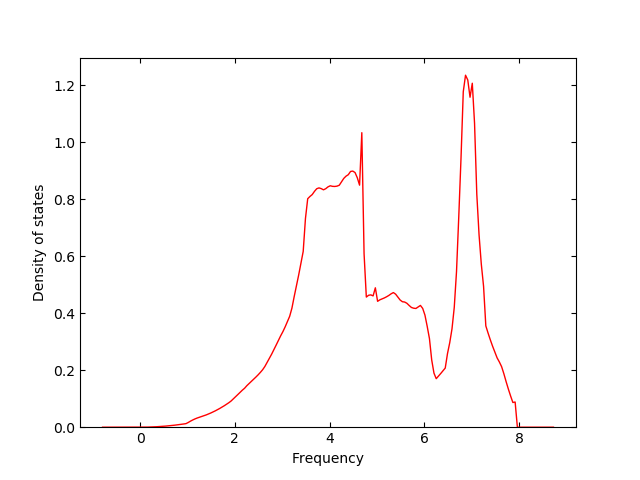
Running produces the plot for the phonon DOS as well as a total_dos.dat file that can be used in gnuplot.$phonopy -p mesh.conf -v
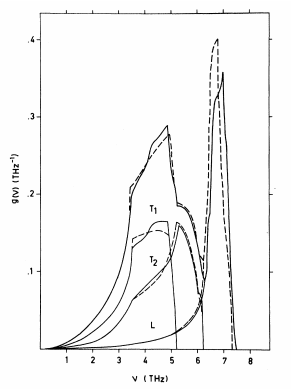
The calculated phonon frequnency distribution (left) is shown next to the experimental distribution [3] (right).
[1] Klein, B. M., & Cohen, R. E. (1992). Anharmonicity and the inverse isotope effect in the palladium-hydrogen system. Physical Review B, 45(21), 12405.
[2] Togo, A., & Tanaka, I. (2015). First principles phonon calculations in materials science. Scripta Materialia, 108, 1-5.
[3] Nilsson, G., & Rolandson, S. (1973). Lattice dynamics of copper at 80 K. Physical Review B, 7(6), 2393.
[4] Sinha, S. K. (1966). Lattice dynamics of copper. Physical Review, 143(2), 422.